

Mystery Shopping Insights – Australian Call Centres
The Latest Monthly Insights into the Performance of Australian Contact Centres!
Each month, we conduct mystery shopping calls for either sales and/or customer service scenarios into a cross-section of Australian businesses to provide a real insight into the experience customers are receiving from their contact centres.
Every single mystery shopping call is meticulously assessed against premium customer service standards containing over 30 different individual performance elements to generate three key metrics:
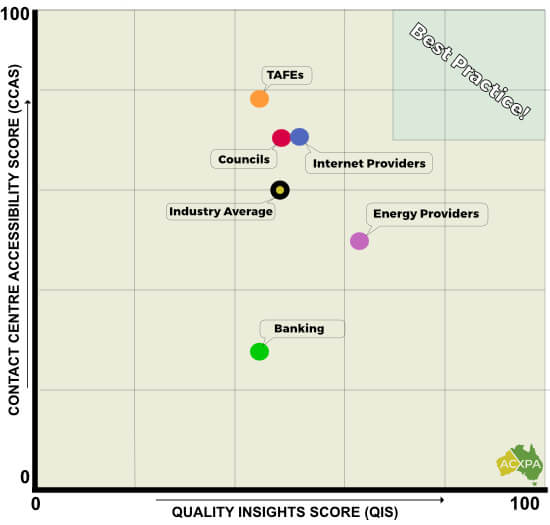
- The Contact Centre Accessibility Score (CCAS) – How easy was it to connect to a live contact centre agent.
- The Quality Insights Score (QIS) – The experience received during the interaction with the live contact centre agent.
- An overall performance score, the ACXPA Contact Centre Insights Score (ACCIS).
This combination provides powerful, independent insights into the performance of the Australian Contact Centre industry, enabling us to ensure we provide the resources, skills and insights where it matters most to help businesses improve the experiences for the customer and their business.
Summary results are available below and ACXPA members have access to the full dataset, plus the opportunity to gain insights into how to improve their scores through the sharing of best practices, resources, training and support.
If you’d like to see detailed reporting for your contact centre, plus a minimum of five of your nominated competitors, please refer to our Contact Centre CX Benchmarking Service.
Latest Call Centre Rankings
(calls made in August 2023)
Top-Ranked Contact Centres
- City of Onkaparinga, SA (87.3%)
- Aussie Broadband (77.8%)
- Brisbane City Council, QLD (75.7%)
- Simply Energy (69.7%)
- iiNet (68.0%)
Lowest-Ranked Contact Centres
- ANZ (0%)
- Westpac (6.6%)
- AGL (22.8%)
- City of Casey, Vic (24.9%)
- Bendigo Bank (25.3%)
How ACXPA is driving Australia’s Contact Centre industry forward
Contact Centres provide a great career opportunity for many Australians and the capacity to earn significant salaries, and they can (and should) play a significant role in helping businesses to achieve their objectives, whilst delivering great experiences for customers (both are possible!).
As an industry association that represents and supports the customer experience (CX) and contact centre industry in Australia, our goal is to help equip new, emerging and existing contact centre managers with the skills, resources, insights, thought leadership and support they need to succeed, and to help educate senior executives on the link between providing great customer experiences and increased profitability.
We do this by providing live monthly Industry Symposiums and a Video Library of expert presentations you can watch on demand, benchmarking data and insights, training courses, fortnightly roundtables for contact centre managers & CX professionals, downloadable resources, industry glossary, private support groups and lots more!

August 2023 Australian Contact Centre Industry Performance
Executive Summary
Throughout August 2023, we conducted a range of Mystery Shopping calls to different industry sectors to reveal insights into the customer experience that customers receive when contacting organisations via their contact centre.
In this month’s August 2023 Call Centre Wait Times in Australia report, we’ve provided industry sector snapshots for:
- Banking (New customer enquiry to invest some money)
- Councils (General Enquiries)
- TAFEs (New course purchase enquiry)
- Energy Providers (New customer sales opportunity)
- Internet Providers (New customer sales opportunity)
For each sector, we’ve randomly selected a minimum of five different businesses with the key observations including:
- 44% of calls to banks (for sales-related calls) were not answered either due to delays in excess of 10 minutes or due to technical glitches with the answering service/IVR.
- Banks were rated as the poorest performers of all industry sectors in both accessibility and the quality of the interactions.
- Internet Providers (60.4%) were rated as providing the best customer service, however, still well short of providing a premium level of customer service.
- The average time stuck in an IVR (press 1 for this, 2 for that) was 0.43 minutes, which customers are forced to go through before being able to connect to a live agent. Councils (0:20 minutes) offered the fastest navigation with Banks the longest (1:10 minutes) with up to 5 layers of options.
- The average wait time across the industry was 03:13 minutes with the best sector Internet Providers (0:51 seconds) with banks the longest (4:42 minutes)
- Energy Providers delivered the best quality over the phone (63.9%) with Banks the poorest (44.7%,) just marginally behind TAFEs (45.9%).
- Across the five quality metrics we assess, ‘Engage’ was the poorest across the industry, resulting in customer interactions that start poorly, and they don’t tend to improve from there.
The report and data below provide summary insights across the core competencies we use to assess performance. Each month, we’ll continue to add additional sectors and businesses.
If you’d specifically like your business or industry sector to be included, please refer to our Contact Centre CX Benchmarking Service.
Ranking Key:
Poor
< 45%
Below Expectations
46% to 60%
Meets Expectations
61% to 75%
Exceeds Expectations
76% to 90%
Outstanding
> 90%
Overall Performance Scores for August 2023
The ACXPA Contact Centre Insights Score (ACCIS) provides an overall performance score for contact centre performance in Australia based on live Mystery Shopping calls that consists of two primary components:
- Contact Centre Accessibility Score (CCAS) – measuring the experience of connecting to a live contact centre agent.
- Quality Insights Score (QIS) – the experience measuring the interactions with a contact centre agent.
We add both scores together and apply a weighting of 70% to the QIS score and 30% to the CCAS score to determine the final ACCIS score, along with some additional percentage deductions based on the overall call answered percentage.
This places a higher weighting on the quality (and skill) of the interaction with the expectation that getting through to an organisation with ease should be the minimum expectation.
The ACCIS score is used to determine the rankings we produce each month, with the latest results below.
50.6%
OVERALL SCORE
INDUSTRY AVERAGE
AUGUST 2023
Averages by Industry Sector
Banks
Internet Providers
TAFES
Energy Providers
Councils
View Additional Information By Sector: Banks | Councils | Energy Providers | Internet Providers | TAFES
August 2023 Overall Rankings by Sector Leaderboards
Accessibility
The Contact Centre Accessibility Score (CCAS) measures the experience before interacting with a live agent. Performance is measured across five different categories and 30 individual elements including:
- Queue Wait time.
- Navigation time.
- How easy it was to find the phone numbers.
- How easy it was to navigate the menu (press 1 for this, 2 for that).
- Quality of audio.
- And lots more!
60.3%
ACCESSIBILITY
INDUSTRY AVERAGE
AUGUST 2023
Averages by Industry Sector
Banks
Internet Providers
TAFES
Energy Providers
Councils
View Additional Information By Sector: Banks | Councils | Energy Providers | Internet Providers | TAFES
Quality
The Quality Insights Score (QIS) measures the experience a customer has when interacting with a contact centre agent for either a customer service or sales call.
- Sales Mystery Shopping calls simulate a potential new customer with scenarios leading up to the point of purchase.
- Customer Service Mystery Shopping calls simulate general enquiries where no identifying information is required to be provided.
Mystery Shopping phone calls are conducted to simulate real customers across a range of scenarios, enabling us to assess the customer experience across five core competencies and 18 call-handling behaviours that directly correlate to better customer and business outcomes.
Learn more about the Australian Contact Centre Quality Framework >
53.2%
QUALITY
INDUSTRY AVERAGE
AUGUST 2023
Banks
Internet Providers
TAFES
Energy Providers
Councils
View Additional Information By Sector: Banks | Councils | Energy Providers | Internet Providers | TAFES
Average Call Centre Wait Times
Queue Wait Times by Industry Sector
The Average Call Centre Wait Times in Australia measures the time to connect to a live call centre employee in Australia, after navigating the IVR systems (press 1 for this, press 2 for that).
For most people, they would refer to this as waiting in a call centre queue, and it’s often the measure that has the highest correlation to customer frustration.
*Mystery Shopping calls are terminated at 10:00 minutes for sales calls and 15:00 minutes for customer service calls so any wait times above this are not included meaning actual wait times would be higher than reported.
Industry Average
Lead Sector: Internet Providers
Longest Sector: Councils
Banking
(New Customer Scenario)
Sector Average
Shortest Average Wait
Longest Average Wait
Energy
(New Customer Scenario)
Sector Average
Shortest Average Wait
Longest Average Wait
Internet
(New Customer Scenario)
Sector Average
Shortest Average Wait
Longest Average Wait
TAFEs
(New Customer Scenario)
Sector Average
Shortest Average Wait
Longest Average Wait
Councils
(New Customer Scenario)
Sector Average
Shortest Average Wait
Longest Average Wait
View Additional Information By Sector: Banks | Councils | Energy Providers | Internet Providers | TAFES
How many contact centres do you assess in each sector?
Each month we do a snapshot of the industry and typically mystery shop a minimum of five different businesses in each sector.
Can I get the data for each contact centre that was assessed in each sector?
Yes, businesses that join the Contact Centre CX Benchmarking Service receive data on all the contact centre centres assessed in the same sector as you (we guarantee a minimum of five other competitors will be included).
How many mystery shopping calls do you conduct for each business?
A real customer makes their assessment off the single call that they make – they don’t care about averages and minimum sample sizes – their entire judgement will be made from that one call. Harsh, but true.
At a minimum, we will conduct at least three different calls at different times and days to each business and we assess each call across over 40 different metrics.
Is there a way to ensure my contact centre is included?
Yes, please refer to our Contact Centre CX Benchmarking Service which offers a fixed-priced model. Businesses that are subscribed to the service will have their results included in the published results each month.
Is there trend data available?
The service has just launched in September 2023 and additional trends and insights will be made available for ACXPA Members. View Membership options >